Essential Excel formulas to improve office productivity
Microsoft’s Excel software is useful in so many situations, both personally and professionally. We take a look at some essential Excel formulas and tips that can make you more productive.

Microsoft Excel was first released back in 1987, but it wasn’t until around 1993 that the spreadsheet software started to be widely used. Since then, it’s become the industry standard for spreadsheets, adding all types of functionality and features. As such, there are some essential excel formulas that can benefit all kinds of users.
The list of useful Excel formulas and functions is nearly endless. The software can be used for all kinds of purposes, such as for creating budgets, managing data, creating graphs and charts, and more. As such, there are formulas that can benefit specific situations.
For our list of essential Excel formulas, we’ll focus on those that can be applied to just about any situation. They can help with your productivity and make navigating your spreadsheet a whole lot easier.
Why learn Excel?
Excel is a popular piece of software. So popular, in fact, that Microsoft estimated that in 2017, around 1 in 5 adults on the planet used it. Despite the rise in popularity of competitor programs such as Google Sheets, Excel is still probably the most widely used tool in the world for understanding data.
It’s not hard to see why the program is so popular. Over the many years since its launch, Microsoft has refined and improved the software to make it as intuitive and user-friendly as possible. It’s also highly functional, capable of saving you time on a multitude of tasks.
Not only is Excel a useful tool in your everyday life, but it’s also a tool still frequently used in businesses. Employers often list the program on job requirements, and a strong working knowledge can make you stand out. As far as digital skills go, it’s one of the fundamentals.
One area with particularly high demand is data analytics. With our course on Excel and data analytics, you can learn some of the fundamentals of how the software can be used to collect and interpret vast amounts of information.
Ready to build career-ready Excel skills with top universities and expert educators? Explore our range of online Excel courses.
Why use formulas?
One of the most useful features of Excel is the fact that you can use functions and formulas. There is a slight difference between these two terms:
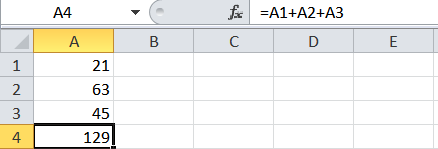
- Formulas. These are expressions you can use to calculate the value of cells. Take the example below – you can add together cells by writing out the formula seen here, =A1+A2+A3.
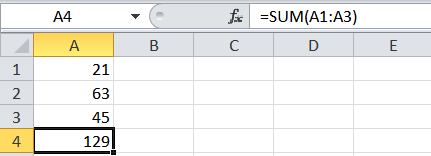
- Functions. These are pre-set formulas that are built into Excel. They often make for a shorter and more convenient way of carrying out tasks using the program. The example below shows the SUM function that performs the same calculation as the formula above. =SUM(A1:A3).
As you can see, Excel’s built-in formulas are a more elegant solution than writing out full calculations. They can save you time, help you manipulate huge chunks of data at once, and are more accurate than writing out long equations.
Essential Excel formulas and tips
So, it’s time to turn our attention to some of the most essential Excel formulas for general use. Some of these are fairly basic, while others are more detailed. They can help you with a wide variety of tasks when using the software.
How to add text to a cell in Excel
If you’ve got a list of data and you want to add text in, there are a couple of useful options available. One thing you should avoid doing is typing in the words yourself. It can take ages, and your time is better spent elsewhere. For those who work in creating digital content, these are essential excel formulas for help with things like managing product data.
Here are two formals you can use.
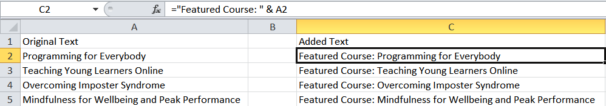
- & formula. With this, you can add a specific text before or after the value in another cell. You add the text you want to include in speech marks and include the cell you want to feature. Dragging the cell C2 down auto-fills the formula with the next cell in the series. The formula is: =”Your Text “ & A2. Replace the text and the cell number as necessary.
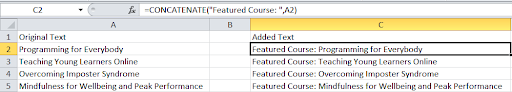
- Concatenate function. This function works in a similar way and is particularly useful for stringing together many different cells. You can combine a variety of text and data using this function. The function is =CONCATENATE(“Your Text”,A2).
Excel multiplication formula
There are several ways you can use Excel for multiplications. The method you choose really depends on the type of data that you’re working with, as well as how you want the final result to display. It’s one of the essential Excel formulas for things like bookkeeping for personal and business accounting.
These methods cover the straightforward and the more advanced:
- * formula. Using the asterisk (*) symbol is the easiest way of multiplying two values. For example, to multiply 7 times 5, you’d write =7*5. Although this is simple when it’s just two numbers, you need to bear a few things in mind for more complex multiplications. If you type =7*5+8*8, Excel will perform 7 times 5, and then 8 times 8 and add them, equalling 99. However, =7*(5+8)*8 will result in 728, as Excel adds the 5 and 8 first (13) and then does 7 times 13 times 8.
- PRODUCT function. The PRODUCT function allows you to easily multiply several numbers, cells, or ranges of cells. It saves you having to write out a long formula, especially when you have a lot of data to deal with. Take the example below. It multiplies all of column A times by all of column B using this formula =PRODUCT(A1:A5,B1:B5), much easier than =(6*4*8*7*3)*(2*4*8*3*7).

IF Excel function
The IF function in Excel is incredibly useful, used in all kinds of situations. When you’re managing data and want to determine which cells meet certain criteria, there are few better ways than using an IF statement. It allows you to compare whether a value is true or false based on what you input.
When you’re working in Excel, if you start typing an IF statement, you’ll get this outline that you have to follow: =IF (logical_test, [value_if_true], [value_if_false]). That looks complex, but let’s apply it to something like test scores.
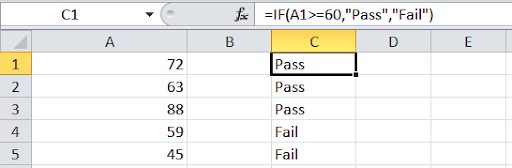
Say we want to give a ‘Pass’ or ‘Fail’ grade on a test based on score, where a passing mark is 60 or higher. The logical_test is whether the score is equal to or above 60. With value_if_true, this means the criteria is met, value_if_false means it is not.
So, we can write this in Excel as, =IF(A1>=60,”Pass”,”Fail”). This means, if the score in cell A1 is 60 or over, then write ‘Pass’. If it’s lower than 60, then write ‘Fail’.
Excel array formula
So far, we’ve mainly looked at performing one operation on one set of values. But what if we want to apply a formula to multiple items? This is where array formulas come in handy. They allow you to perform an operation on multiple values.
An Excel array formula looks at an array of individual values and performs multiple calculations on one or several of these values. It’s incredibly useful for things like financial accounting.
Let’s take a look at an example. Let’s say you want to calculate the total value of sales of multiple items. Rather than calculating subtotals for each type of item and adding them together, an array formula can make things quicker and neater.
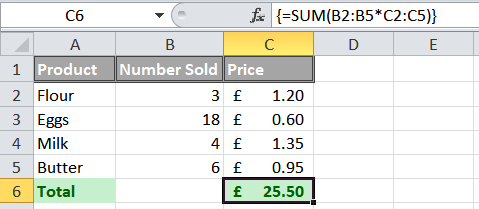
So, where you want the total to display, you type =SUM(B2:B6*C2:C6). You then use the keyboard shortcut CTRL + SHIFT + ENTER to complete the array formula, adding the curly brackets. What this does is multiply the values in the specified array and then adds the subtotals together.
-

 Bond University Data Analytics for Decision Making: An Introduction to Using ExcelBusiness & Management,IT & Computer Science
Average formulas in Excel
Let’s take a quick step back to secondary schools maths (sorry!). You might remember that there are three main types of average, the mean, median, and mode. Excel can help you find each of these averages, making it a handy tool for data analysis. If you need a quick refresh:
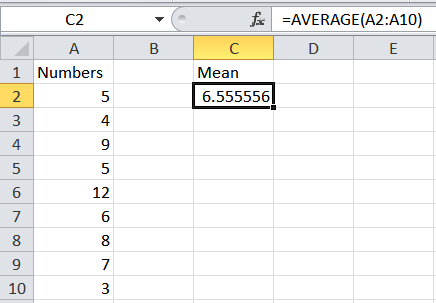
- Mean. Where you add up all the numbers and divide by the number of numbers you have.
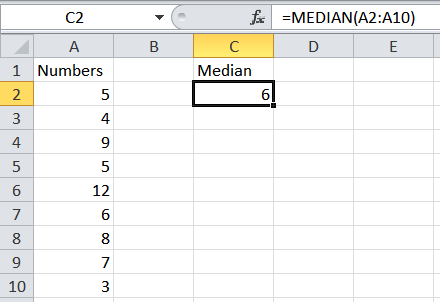
- Median. The number in the middle of your numbers when they’re in size order.
- Mode. The number that occurs the most in a set of numbers.
Let’s look at the formulas excel uses to calculate these types of average:
- Mean. This is the average that most people are familiar with. As such, Excel uses the AVERAGE function when you’re finding the mean average of a set of numbers:
- Median. This one is pretty straightforward, as it uses the MEDIAN function. Your list doesn’t even need to be in ascending order for it to find the median:
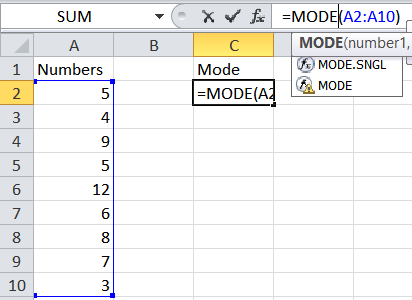
- Mode. Once again, this is pretty self-explanatory. However, it’s worth noting that you can choose either a single mode or multiple modes. With the single function, you’ll get the lowest mode.
Percentage formula in Excel
When it comes to essential Excel formulas, there are few that are as useful as the percentage calculations. There are various simple ways that you can calculate or show percentages:
- Show a decimal as a percentage. If you find that your values are showing in decimals rather than percentages, you can simply click the % icon on the top bar to display them as a percentage.
- Percentage of total. If you want to work out the percentage (A1) of the total (B1), all you need to do is enter = A1/B1 in the cell you wish to calculate the percentage. You’ll then need to hit the % icon to display as a percentage.
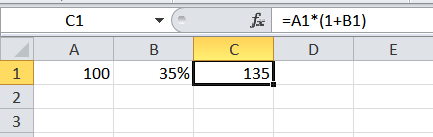
- Percentage increase. Again, a simple equation can help you with this one. Your starting value goes in one cell, and the percent you want to increase in another. See the example below using the formula =A1*(1+B1). For a percentage decrease, change the + to a -.
VLOOKUP in Excel
The VLOOKUP function in Excel is the ideal tool for searching large data tables for certain information. Essentially, you look for correlated data and pull it out of the table, without having to search through it. For those who work with databases, it’s a useful function that can save a lot of time.
Let’s take a look at an example. Imagine we have a list of customers for a business. Each customer has their own unique ID number, and we have records for their name, email address, phone number etc. Rather than have to scroll through a vast table to find one piece of data about a customer, we can use a VLOOKUP to automatically produce it.
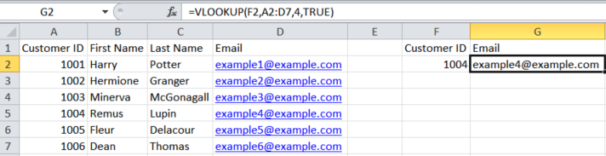
Here’s what the formula looks like without the details: =VLOOKUP (value, table, col_index, [range_lookup]). Value is what we’re looking to match against, and this must be in the first column of a vertical table. The col_index is the column in the table we want to find the value for. The range_lookup is optional, but means we can have TRUE (an approximate match) or FALSE (an exact match).
See the example below. We’ve used the customer ID number to quickly lookup the email address of that customer:
Excel variance formula
Variance is a measure of how far a set of data is spread out. For example, a high variance suggests that the data points are very spread out from the mean average and each other. In investing, for example, it can be used to compare how assets in a portfolio perform relative to each other and the average.
There are various functions in Excel that work out variance. These account for whether you’re calculating the variance in a sample or whole population, as well as whether you want to evaluate or ignore text and logical values.
-

 The Excel Club Excel Skills to Make an ImpressionIT & Computer Science,Business & Management4 weeksFind out more
 -

 4 courses 10 weeks IntroductoryFind out more
To keep things straightforward, we’ll focus on the standard variance function. This focuses on data samples and ignores text and logical values. Below, you can see how the VAR.S function is used:
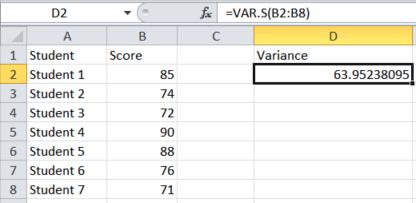
You could also work out the standard deviation of this same set by using the formula =STDEV.S(B2:B8).
Excel profit chart
So far, we’ve focused mainly on essential Excel formulas and functions. For our last point, we’re going to take things a step further. Excel is a fantastic program for spreadsheets and organising data, but it’s also great for displaying that data once you’ve analysed it.
Let’s take a look at how to make a simple Excel profit chart, showing an example of how much profit a business made over a certain amount of time. Here’s what the table looks like:
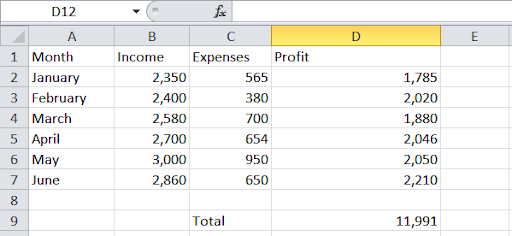
Although this does display the data, it’s not the most visually appealing way of presenting it. Instead, you can transform it into a chart that gives a different way of looking at the profit. It’s a simple process that can be completed with the click of a button.
First, navigate to the ‘Insert’ tab at the top of Excel. Next, you’ll see a range of options for charts and graphs. Selecting one of those will automatically populate the display with the data from your spreadsheet:
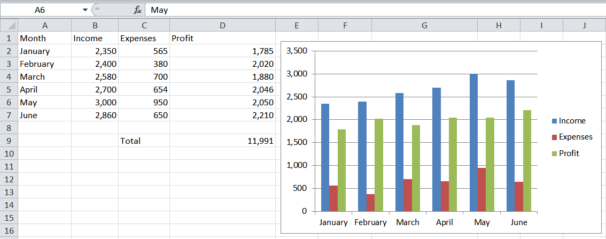
From here, you can format the chart by changing the style, the colours, the data, and many other aspects of it. When you’re trying to present your data in a clear and concise way, Excel is always a good choice.
That covers our list of some of the essential tips and tricks for Excel. As you can see, not only are there many different things you can do with the program, you can use them in a wide variety of situations. With a little know-how, you can save yourself time and effort when it comes to analysing data.
Businesses of all kinds are on the hunt for people with Excel skills. As suck, knowing how to use the program can really make you stand out from the crowd.
Our course on Excel and data analytics provides a more detailed look at once specific use of the software. However, the wonderful thing about Excel is that you can combine all sorts of functions and formulas to solve problems and get results.
Join ‘An Introduction to Using Excel’